During a recent Oracle Meetup in Paris, I met Martin Bach and Bertrand Drouvot. Martin was here to present on Application Continuity, and we had an interesting discussion about this technology. (Bertrand had recently published an interesting post about Application Continuity in a Dataguard configuration … here).
In the post, I will explain quickly how it works based on an sample code I wrote few months ago. I will explained too application continuity resources allocation, where they are consumed, and how much is the resource overhead.
12c Application Continuity … What is it and how does it work?
Application Continuity is a technology that will improve application availability. Before Oracle 12c, Transparent Application Failover (TAF) or Fast Connection Failover (FCF) coud help you to improve application availability without downtime, but developers usually have to implement a TAF or FCF aware code. And usually, it’s wasn’t the case for many reasons (testing and UAT platform which weren’t RAC platform, specifications weren’t written in this aim etc.).
In 12c, Oracle releases application continuity. This technology will do the same thing with more simplicity and has been developed to handle planned and unplanned outages.
Application Continuity works on Oracle 12c database and with application that use:
- Oracle Weblogic Server
- Oracle UCP (Unified Connection Pool)
- Third party JAVA application server which used the PooledConnection Interface
- JDBC Thin-driver
The lab …
To test application continuity, I wrote a simple test case based on :
- a 12c (12.1.0.2) RAC Cluster with a container database (CDB), a Pluggable Database (PDB), and a Database Schema (LAURENT) with on 2 tables and a “spy” trigger.
- a small Java Code sample.
On the database side, I created a TEST table add fill it with 500000 rows, and another one (SPY_TABLE) which will track the id of the TEST table that have been modified :
SQL> create table test as select rownum id, dbms_random.string('U',20) v from dual connect by level <= 500000;

Table created.

SQL> create table spy_table(d date, inst_name varchar2(16), id number);

Table created.
Row updates tracking is made by a trigger on update on the TEST table:
SQL> create or replace trigger spy_test
 2  before update on test for each row
 3  declare
 4    pragma autonomous_transaction;
 5  begin
 6    insert into spy_table values(sysdate,sys_context('USERENV', 'INSTANCE_NAME'), :old.id);
 7  commit;
 8  end;
 9 /

Trigger created.
To make the test, we have to create a RAC service for our database which have these features:
- FAILOVER_TYPE has to be set on TRANSACTION to enable Application Continuity
- COMMIT_FAILOVER has to be set to TRUE (Even if it’s a parameter related to Transaction Guard, you have to set it)
- REPLAY_INITIATION_TIMEOUT, FAILOVER_RETRIES, FAILOVER_DELAY should be reviewed to configure the delays for the replay (see this link for more information)
[oracle@rac1 JAVA]$ srvctl add service -d cdb -s app -preferred cdb1 -available cdb2 -pdb pdb -j SHORT -B SERVICE_TIME -z 30 -w 10 -commit_outcome TRUE -e TRANSACTION -replay_init_time 1800 -retention 86400 -notification TRUE
[oracle@rac1 JAVA]$ srvctl start service -s app -d cdb

[oracle@rac1 JAVA]$ srvctl status service -d cdb
Service app is running on instance(s) cdb1

[oracle@rac1 JAVA]$ /u01/app/12.1.0/grid/bin/crsctl stat res ora.cdb.app.svc -t
--------------------------------------------------------------------------------
Name           Target  State        Server                   State details
--------------------------------------------------------------------------------
Cluster Resources
--------------------------------------------------------------------------------
ora.cdb.app.svc
      1        ONLINE  ONLINE       rac1                     STABLE
--------------------------------------------------------------------------------
Note: I voluntarily configured the service with a preferred node to be sure It will be always the same I will use for my tests (related to resources). But I recommend you to configure it with all instances as “preferred”.
The Java source code is available at this link.
Procedures and functions are:
- pressAnyKeyToContinue: it’s a private method that make a pause during the program. This pause can be useful to attach a JConsole or VisualVM to track JVM memory and CPU.
- getStatValue: this function returns the value of an oracle statistics for the current session.
- doTx: this is the most important function in this program. It will perform the transaction and it’s in this one you will find the most important thing when we code Java with Application Continuity: the callback. This callback is delimited by two calls: beginRequest and endRequest. In this callback, you will put all of the operation you want to protect against failures. If a planned or unplanned outage occurs during the callback, the transaction will be rolled back and then replayed. Please note that in the callback area, you have to:
- call the prepareStatement function to assign the SQL statement, otherwise you will throw a SQLRecoverableException during the connection failover.
- disable autoCommit for the connection.
- put a commit statement to say where the transaction ends.
    private void doTx(Connection c, int numValue) throws SQLException {
        String updsql = "UPDATE test " +
                        "SET v=UPPER(v) " +
                        "WHERE id=?";
        PreparedStatement pstmt = null;

        /* Beginning of the callback
         * AutoCommit has to be disabled in the callback part.
         */
        ((oracle.jdbc.replay.ReplayableConnection)c).beginRequest();
        pstmt=c.prepareStatement(updsql);
        c.setAutoCommit(false);
        for (int i=0;i<numValue;i++) {
            pstmt.setInt(1,i);
            pstmt.executeUpdate();
        }
        c.commit();
        // End of the Callback.
        ((oracle.jdbc.replay.ReplayableConnection)c).endRequest();
        pstmt.close();
    }
- In the main function, the most important thing is to use the new OracleDataSourceImpl class instead of OracleDataSource.
Then, I compile the code and run it with the number of updates I want to execute in my transaction.
First run
During the run, I execute a “kill -9” against the PMON process of the instance where my java program is connected to:
[oracle@rac1 JAVA]$ ./launchJava.sh SimpleAC 50000
Instance Name = cdb1
Press any key to continue...
Performing transactions

<<<< KILLED THE PMON PROCESS HERE >>>>

Instance Name = cdb2
CPU used by this session = 38643
session pga memory max = 4140696
We can see that, even with an instance failure which was running a transaction (of 50000 updates), the failover occurs without any error message.
The Spy table shows the results above:
SQL> select inst_name,count(*) from spy_table group by inst_name;

INST_NAME	   COUNT(*)
---------------- ----------
cdb2		      50000
cdb1		       1270
This proves that the transaction has been rolled-back and completely replayed after the connection failover.
Mutable values
When a transaction becomes replayable, a problem comes with what we call a mutable value. If you are interested by the definition you can read this on wikipedia: http://en.wikipedia.org/wiki/Immutable_object. But I prefer to explain this in a different way.
Imagine we do a close test to the previous one, but instead of updating data, we insert lines into a table and in this table, we have a timestamp column which takes the value of systimestamp oracle function when we insert a line. Now an outage occurs, the connection if failed over and the transaction is rolled back and replayed on the other node. If we don’t say to Oracle that this value is immutable, the value will be inserted at the timestamp recorded on the second node and not the original one and this could cause some problems in your data integrity.
This problem occurs with sysdate, systimestamp, sequence values and another function that depends on your process id (and other parameters) : SYS_GUID.
If you want to make your variables immutables, you need to have the KEEP grant:
SQL> show user
USER is "SYS"
SQL> grant keep date time to laurent;

Grant succeeded.

SQL> grant keep sysguid to laurent;

Grant succeeded.

SQL> connect laurent/laurent@rac-scan:1521/app
Connected.

SQL> grant keep sequence on seq1 to laurent;

Grant succeeded.
No pain, no gain … what about resources consumption?
Application continuity is a good thing because, with less code modification your java app will become completely fault tolerant. As the documentation mentions, there’s an overhead on CPU and memory … then, let’s check this !
To test this, I used the same environment than previously but I didn’t kill any process, I just ran it with and without callback definition.
Then I measured different things:
- CPU used by the database session (statistic: CPU used by this session)
- Memory consumed by the database session (statistic: session pga memory max)
- CPU used by the java program
- Memory consumed by the java program (Java heap memory usage)
CPU and memory consumed by the java program has been measured with this good old Jconsole.
To get the java heap memory usage, I set up the program with a heap size of 512Mb as it was the good value to avoid garbage collection during execution.
Here are the results:
[oracle@rac1 JAVA]$ egrep 'beginRequest|endRequest' SimpleAC.java
((oracle.jdbc.replay.ReplayableConnection)c).beginRequest();
((oracle.jdbc.replay.ReplayableConnection)c).endRequest();
[oracle@rac1 JAVA]$ ./compile.sh
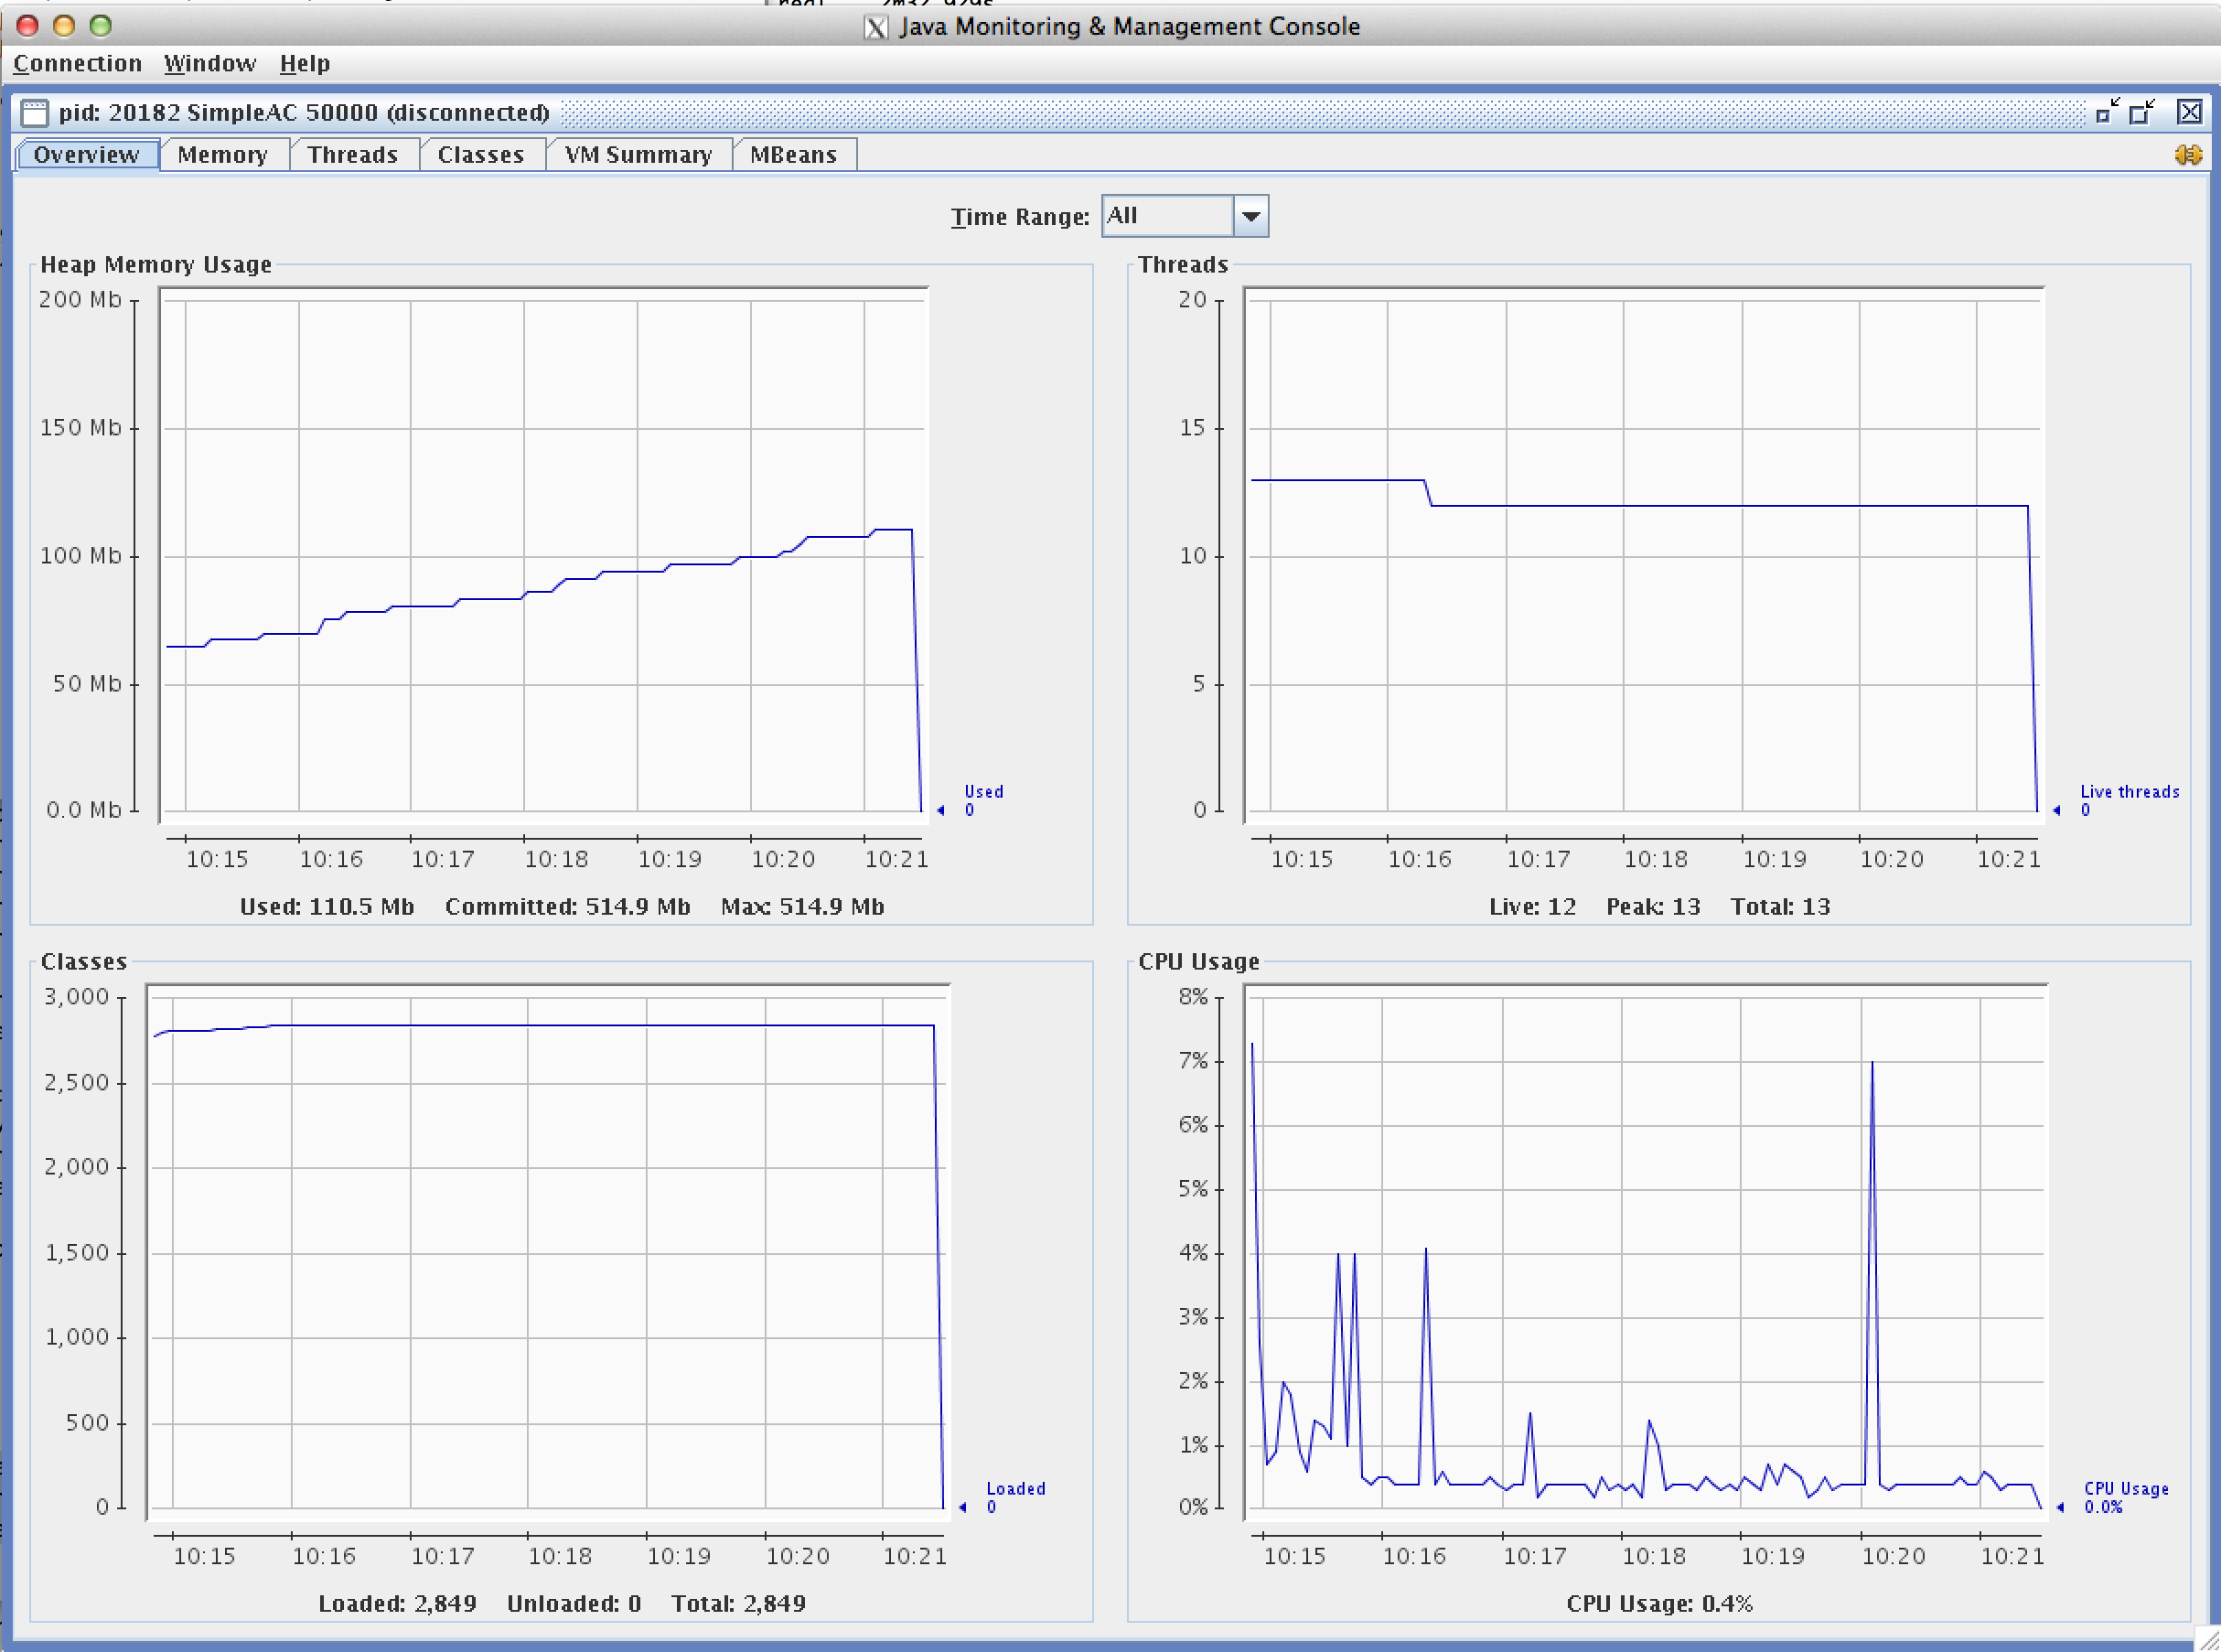
[oracle@rac1 JAVA]$ ./launchJava.sh -Xms512M -Xmx512M SimpleAC 50000
Instance Name = cdb1
Press any key to continue...
Performing transactions
Instance Name = cdb1
CPU used by this session = 34859
session pga memory max = 3961144

Note the heap memory usage high water mark is 110Mb and the average CPU is 0,4%
[oracle@rac1 JAVA]$ egrep 'beginRequest|endRequest' SimpleAC.java
//((oracle.jdbc.replay.ReplayableConnection)c).beginRequest();
//((oracle.jdbc.replay.ReplayableConnection)c).endRequest();

[oracle@rac1 JAVA]$ ./compile.sh

[oracle@rac1 JAVA]$ ./launchJava.sh -Xms512M -Xmx512M SimpleAC 50000
Instance Name = cdb1
Press any key to continue...
Performing transactions
Instance Name = cdb1
CPU used by this session = 35138
session pga memory max = 3747576

The Heap usage high water mark is 91Mb and the average CPU is 0,2%.
To sum up, we can tell that there is a memory overhead on the jdbc layer (for my example which was based on a transaction of 50000 updates). The CPU overhead announced by Oracle seems to be trivial. On the database side, no overhead has been found on CPU nor on the memory.
If you search more information about Application Continuity, you can read this paper by Oracle : http://www.oracle.com/technetwork/database/database-cloud/private/application-continuity-wp-12c-1966213.pdf